Getting Started
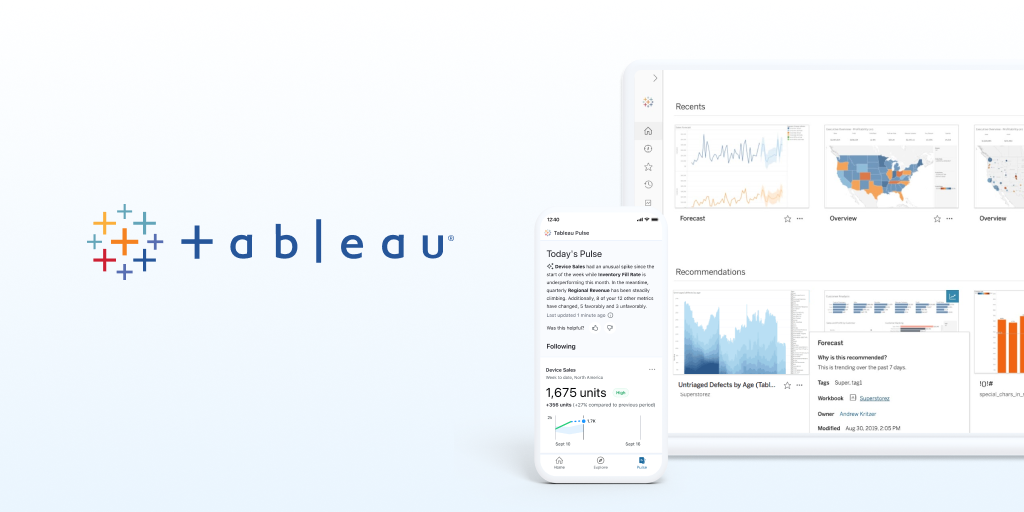
Tableau is a powerful data visualisation and business intelligence tool that helps users transform raw data into interactive, shareable dashboards. To get started, download Tableau Desktop and install it on your computer, or sign up for Tableau Online to access the cloud-based version. Once installed, you can connect to various data sources, including spreadsheets, databases, and cloud services.

Begin by connecting to your data source and importing the necessary data sets. Use Tableau's intuitive drag-and-drop interface to create visualisations, such as charts, graphs, and maps. Combine multiple visualisations into a dashboard, allowing users to explore data interactively. Save your work, and share your dashboards via Tableau Server, Tableau Online, or by exporting them as images or PDFs.
Key Features
- Intuitive Drag-and-Drop Interface: Tableau allows users to create visualisations easily by dragging and dropping fields onto the canvas, making data analysis accessible to users of all skill levels.
- Diverse Visualisation Options: Choose from a wide array of visualisation types, including bar charts, line graphs, scatter plots, heat maps, and geographic maps, to effectively communicate insights.
- Real-Time Data Connection: Connect to live data sources, enabling real-time analysis and visualisation. Tableau automatically refreshes data, ensuring your insights are always current.
- Interactivity and Dashboarding: Create interactive dashboards that allow users to filter, drill down, and explore data dynamically. Dashboards can incorporate actions such as tooltips, highlights, and URL links.
- Collaboration and Sharing: Share your findings with team members or stakeholders using Tableau Server or Tableau Online. Collaborate on projects and publish dashboards for organisation-wide access.
Use Cases
- Business Performance Monitoring
Use Tableau to create dashboards that track key performance indicators (KPIs) across departments, such as sales, marketing, and finance. This enables real-time visibility into business performance. - Customer Analytics
Analyse customer data to gain insights into purchasing behaviours, preferences, and trends. Use Tableau to segment customers and tailor marketing strategies accordingly. - Financial Reporting
Automate financial reporting processes by connecting Tableau to accounting systems. Create interactive financial dashboards that track budgets, forecasts, and actuals for better decision-making. - Operational Efficiency Analysis
Visualise operational metrics to identify bottlenecks and inefficiencies in processes. Use Tableau to analyse data from production, supply chain, or logistics to optimise operations. - Market Research and Analysis
Leverage Tableau to analyse market trends, competitive intelligence, and consumer insights. Create visual reports that help stakeholders understand market dynamics and inform strategic decisions.
Tutorials
Useful Links


